Introduction
I wanted to reverse engineer the protocols of IoT devices, but it had been a while since I’d last traffic inspected a device and I needed to set up something fresh.
In the past I would’ve run Linux on a laptop, spawn an AP, run tcpdump and call it a day. But I put so much effort into building a home network with my Mikrotik router and Ubiquiti APs, and have the ability to use VLANs, so I wanted to do something better.
My goals:
- no reliance on a desktop/laptop for the capturing to function. my home lab server and wireless APs are always on so I want to use these
- TLS termination as I’d need to capture HTTPS & MQTTS traffic
- strong WiFi coverage and speed
- Coverage: I’ll be inspecting robot vacuums which will physically traverse my whole house
- Speed: I’ll be dumping and transferring file systems via the network from IoT devices once I gain root. These may be large and I don’t want to spend too long waiting
- easily capture and override DNS lookups
- easily toggle the inspection
- it’s generally annoying to reset WiFi on an IoT device, so being able to toggle inspection on the Mikrotik is super convenient
- harness the power of
mitmproxyand*sharkprograms likewiresharkandtsharkto understand the protocols on these devices
Building it out
Mikrotik
- Create a new IP pool, assign a VLAN ID
- Create a DHCP server, point the gateway to Mikrotik router, and DNS to something like Google/Cloudflare temporarily
Ubiquiti
- Create a new “Network”, assign it the VLAN ID of the inspection VLAN created above
- Create a new WiFi network, assign it to the network just created
- Suggest using an alphanumeric SSID and password as some IoT devices play funny with symbols
- Suggest forcing 2.4Ghz + WPA2 for compatibility, however if you know the device can support 5Ghz use that
VM
Fortunately I run Proxmox, so it’s very easy for me to spin up a VM for inspection:
ens18- main NIC on main network, can connect to it from my desktopens19- secondary NIC assigned to VLAN ID earlier
Make sure the route tables still have your main NIC as the default route. I’m running Debian and needed to edit /etc/network/interfaces. If you’re using another distro or NetworkManager, follow the appropriate steps.
In the Mikrotik DHCP server, assign this server a static IP, e.g. 192.168.30.2
Software
- Install
mitmproxy - Install
dnsmasq - Install
tcpdump - Install
iptables
mitmproxy
mitmproxy will be used for TLS decryption and termination. The mitmdump output can also be handy to see what’s going on, however we will mainly be using it to capture the pre-master secrets used in TLS handshakes and throw them into tshark/wireshark later.
Run mitmproxy with SSLKEYLOGFILE set to capture the TLS pre-shared keys. For information see here
I run this script. The first argument is the name of the output capture file, and I generally run it out of the directory I want to store my captures. I don’t look at the mitmproxy output often, but it’s nice to have it stored. I call this script mitm.
These commands are from:
- https://docs.mitmproxy.org/stable/howto-transparent/#linux
- https://docs.mitmproxy.org/stable/howto-wireshark-tls/
#!/usr/bin/env bash

set -eu -o pipefail

# ensure dependencies
# https://docs.mitmproxy.org/stable/howto-transparent/#linux
sudo sysctl -w net.ipv4.ip_forward=1
sudo sysctl -w net.ipv6.conf.all.forwarding=1
sudo sysctl -w net.ipv4.conf.all.send_redirects=0
for cmd in iptables ip6tables; do
        sudo "$cmd" -t nat -A PREROUTING -i ens19 -p tcp --dport 80 -j REDIRECT --to-port 8080
        sudo "$cmd" -t nat -A PREROUTING -i ens19 -p tcp --dport 443 -j REDIRECT --to-port 8080
        sudo "$cmd" -t nat -A PREROUTING -i ens19 -p tcp --dport 8883 -j REDIRECT --to-port 8080
done

# for wireshark
export SSLKEYLOGFILE="$HOME"/.mitmproxy/sslkeylogfile.txt
outfile="$1".mitmdump.txt
shift
mitmdump -m transparent --save-stream-file="$outfile" --tcp-hosts='192.168.30.0/24' --raw --ssl-insecure "$@"
dnsmasq
dnsmasq is used for capturing and overriding DNS lookups. Some devices may bypass this of course, but I’ve found most of the time it works well.
Setup dnsmasq to log requests to a file, and point to an upstream DNS
My config looks like this. Anything I want to override I set at the bottom
interface=ens19
server=1.1.1.1
log-queries
log-facility=/var/log/dnsmasq.log
listen-address=127.0.0.1,192.168.30.2
#address=/jmq-ngiot-au.area.ww.ecouser.net/192.168.30.2
address=/jmq-ngiot-au.area.ww.ecouser.net/127.0.0.1
tcpdump
tcpdump is used for capturing TCP/IP traffic on a network interface. It can later be parsed.
Run tcpdump to dump a .pcap flie.
A basic usage is something like this:
sudo tcpdump -i ens19 -U -w idle.pcap
sudo tcpdump -i ens19 -U -w idle.pcap 'host xxx.xxx.xxx.xx'
Setting capturing up
- Go back in the Mikrotik and set the DHCP server’s gateway and DNS to the VM’s IP
- Force a DHCP request by having the device reconnect to the AP
- All requests should be going through the VM, see output in the
mitmdumpscript above
Tying it all together
Things aren’t as usable as they could be as we’re using a VM. I’ve solved a lot of friction by tunnelling things over SSH.
I do the following:
SSH ProxyJump
I use ssh X -J VM to connect to my IoT devices on the inspect network, effectively using my inspect VM as a bastion or jump host.
-J is the ProxyJump flag in SSH. See man ssh for more information
network capture script
I got a bunch of hacky scripts I put together in the heat of the moment to get everything captured in an efficient enough way.
I have a “capture” script, which lives on the VM, and which I execute over SSH. It runs tcpdump and writes output a file on the VM, as well as stdout, and runs mitmdump and outputs the logs to stderr
The capture script looks like this, where ./bin/mitm is the mitmproxy script earlier :
#!/usr/bin/env bash

set -eu -o pipefail

capture_name="$1"
shift
./bin/mitm "$capture_name" >&2 &
pid="$!"
echo 'Run mitm, running tcpdump' >&2
trap 'kill "$pid"; echo dead >&2' EXIT
sudo tcpdump -i ens19 -U -w - 'host xxx.xxx.xxx.xxx' | tee "$capture_name".pcap
I also have a cleanup script. It makes sure everything is dead cause running these commands over SSH does not always gracefully exit.
#!/usr/bin/env bash

killall mitmdump
sudo killall tcpdump
I wrap this in a script on my local machine. I call it capture-mitm:
#!/usr/bin/env bash

set -eu -o pipefail

capture="$1"
shift
trap 'ssh inspect ./bin/cleanup' EXIT
ssh inspect ./bin/capture "$capture" "$@"
In another shell on my machine, I run a script to stream SSLKEYLOGFILE to a file, so tshark and wireshark work as expected.
ssh inspect 'tail -F -n +1 "$HOME"/.mitmproxy/sslkeylogfile.txt' >/tmp/sslkeylogfile.txt
I can now run capture-mitm CAPTURE_NAME | wireshark -k -i - and see in real-time the traffic inspection in wireshark over SSH.
If I look back at the command I can see mitmdump output. If I exit out of the command it’ll stop capturing traffic on the VM. Any session information is stored on the VM in a CAPTURE_NAME.pcap file, so I can revisit it later and parse it with tshark or wireshark again.
I like this setup cause I get live data as well as the “raw” data saved, which is super helpful if you struck upon gold.
socat & dnsmasq
I also use socat & dnsmasq on the VM to expose any services to the IoT device
- similar premise to
ssh -J, I’m using the VM to forward and expose ports from my local machine to the IoT device - e.g.
sudo socat tcp-listen:443,reuseaddr,fork tcp:192.168.88.x:1883- in this example I’m redirecting my IoT devices cloud server to my VM via DNS rewrite using
dnsmasq, then I’m exposing port 443 on my VM to port 1883 on my machine on my home network - when the IoT device wants to connect to the cloud, it’ll resolve the VM via DNS, then connect to the VM, and the VM will connect to my machine which is on another subnet/VLAN and forward the traffic
- if I want the robot to connect to the real cloud, I can replace my machines IP in the
socatcommand with the IP of the real cloud. I could point the DNS record back, but then that’ll require restartingdnsmasqand flushing DNS cache on the IoT device (likely doing a reboot)
- in this example I’m redirecting my IoT devices cloud server to my VM via DNS rewrite using
The result
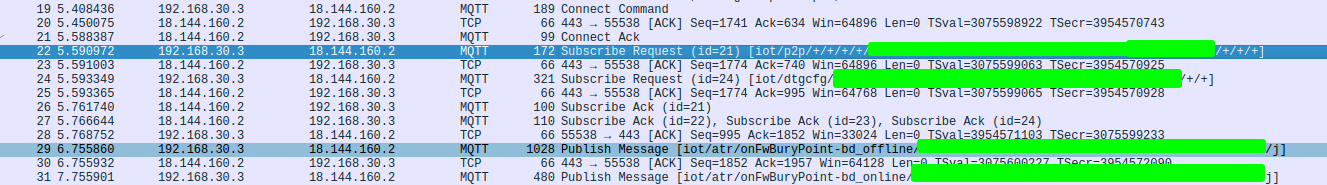
I want to write a separate post on how I do crazy parsing on MQTT traffic via tshark, however here’s a sneak peek of what I can do with the setup above:
Using Wireshark:
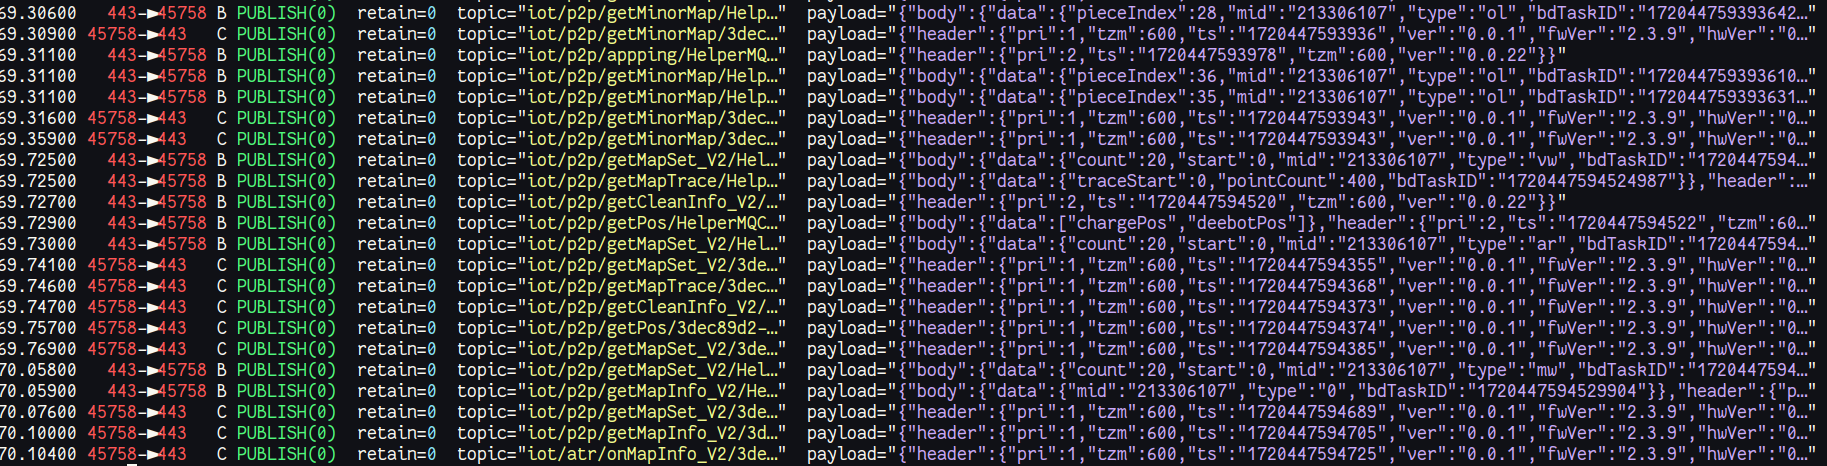
Using my fork of mqttshark:
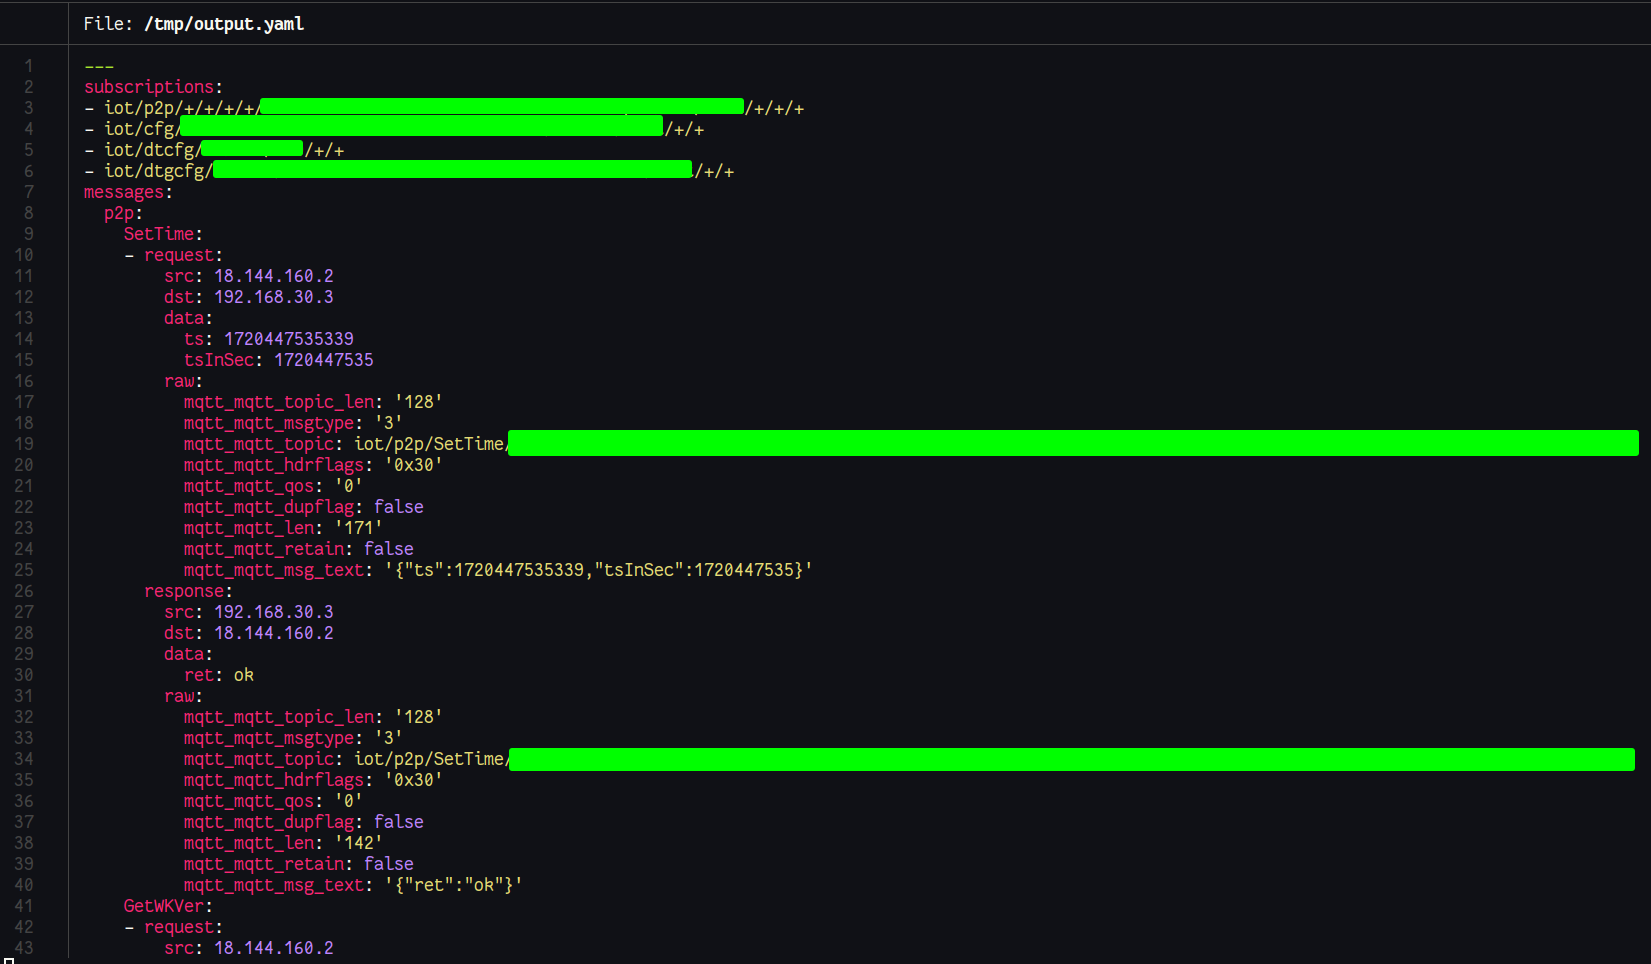
Using a hastily written script which parses the output from tshark , understands the cloud-specific protocol, and dumps an aggregated summarised version into yaml (batches requests and responses), which is easier to read and also parse with tools like jq, gron, and grep:
I got 3 different ways to get information about my IoT device and the messages, which makes reverse-engineering much simpler!
See also
If you’re interested in why I did all this, see:
- https://github.com/itsjfx/ecovacs-hacking
- https://github.com/itsjfx/ValetudoEV/blob/master/ValetudoEV.md
And thanks to the following resources that made this possible:
- https://github.com/bmartin5692/bumper/blob/master/docs/Sniffing.md
- https://docs.mitmproxy.org/stable/howto-transparent/#linux
- https://docs.mitmproxy.org/stable/howto-wireshark-tls
Thank you for reading
Thank you so much for reading my post. If you have any feedback or queries, please reach out to me. My details are on the home page.